

▲圖片來源:COINTELEGRAPH
Ethereum investors who staked millions of dollars worth of Ether (ETH) tokens to become validators on its soon-to-launch proof-of-stake (PoS) network are now facing heavy paper losses.
Ether spot traders outperform stakers by 36.5%
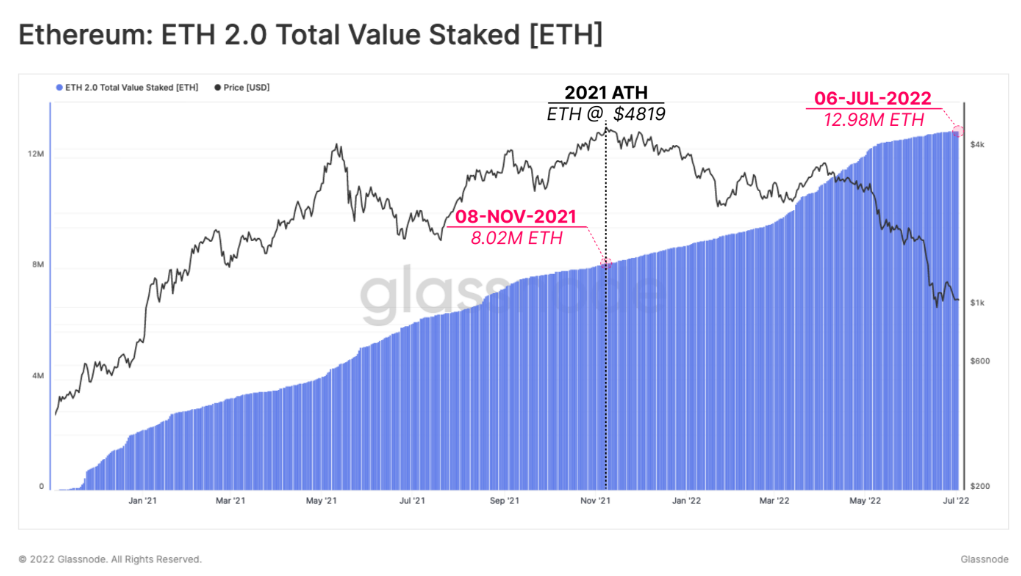
In detail, investors have locked a little over 13 million ETH into the so-called Ethereum 2.0 smart contract since it went live in December 2020. However, there is no date when these investors can redeem their tokens alongside the 10% yield.
Interestingly, around 62% of Ether tokens were deposited before the price peaked at around $4,930 in November 2021. Meanwhile, the other 38% were deposited after the record high, according to Glassnode's latest report.
▲圖片來源:Glassnode
As a result, the total value locked inside the Ethereum 2.0 smart contract peaked at $39.7 billion in November 2021, led by 263,918 network validators. But now, the value has dropped to $14.85 billion as of July 7, despite an additional inflow of 5 million ETH in the last eight months.
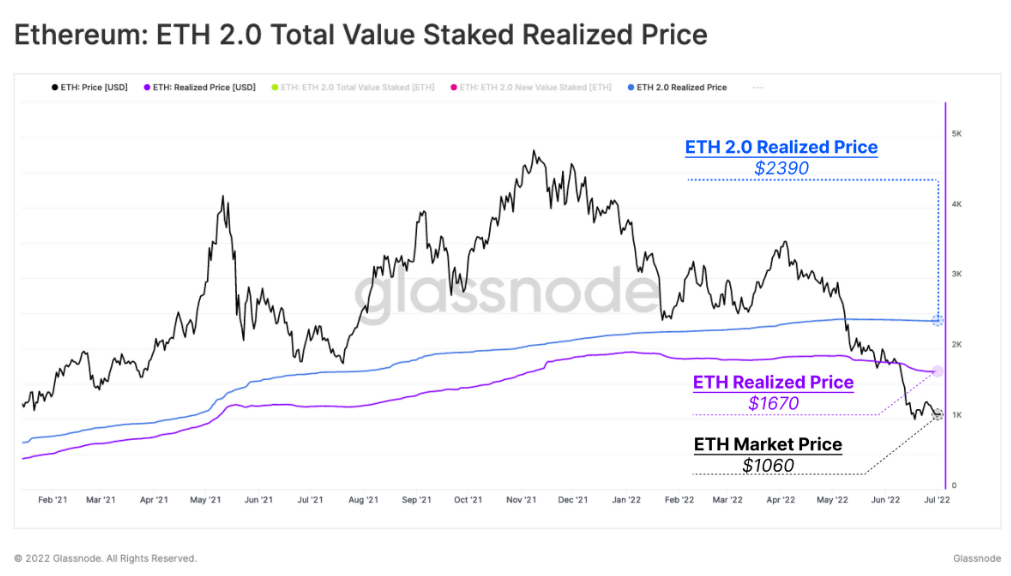
Ethereum 2.0 stakers deposited ETH to the network's PoS contract at an average price of $2,390. So, ETH stakers are now holding an average loss of 55% as a result of ETH's 75% crash since November 2021, Glassnode noted.
Excerpts from its report: "If we compare this to the Realized Price for the entire ETH supply, 2.0 stakers are currently shouldering 36.5% larger losses compared to the general Ethereum market."
▲圖片來源:Glassnode
Possible bullish and bearish scenarios
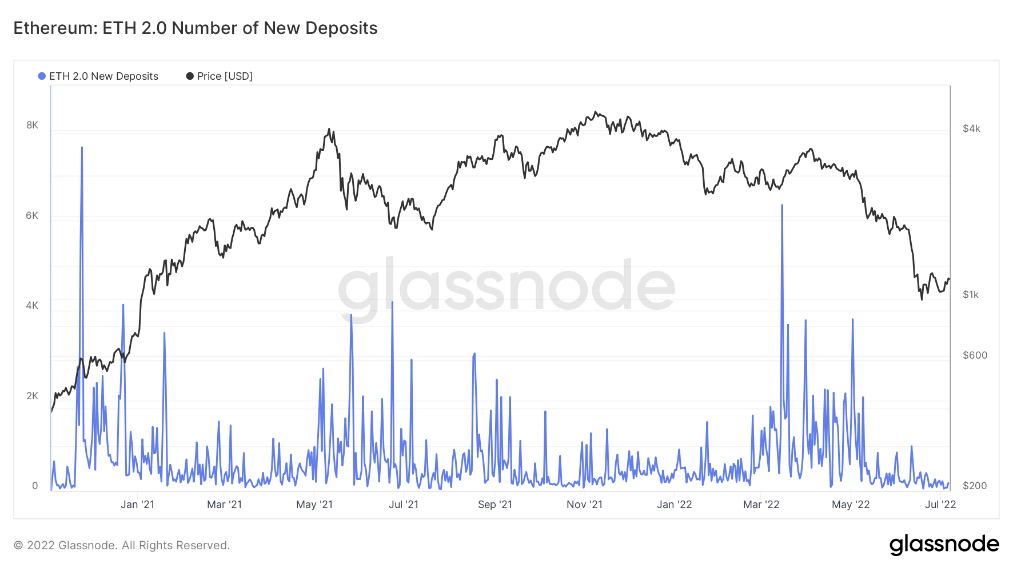
Ether's bear market has also affected Ethereum 2.0 contract inflows.
Notably, the weekly average of 32 ETH deposits into the Ethereum 2.0 contract has fallen to 122 a day compared to 500 to 1,000 per day in 2021. This suggest investors' reluctance to lock their ETH holdings away amid a bear market.
▲圖片來源:Glassnode
From a technical perspective, investors' fears seem to be legitimate.
Ether risks undergoing a major breakdown in Q3/2022 since it has been painting a classic continuation pattern called the ascending triangle, as illustrated in the chart below. Therefore, ETH's price could decline to nearly $800, almost 32% lower than today's price.
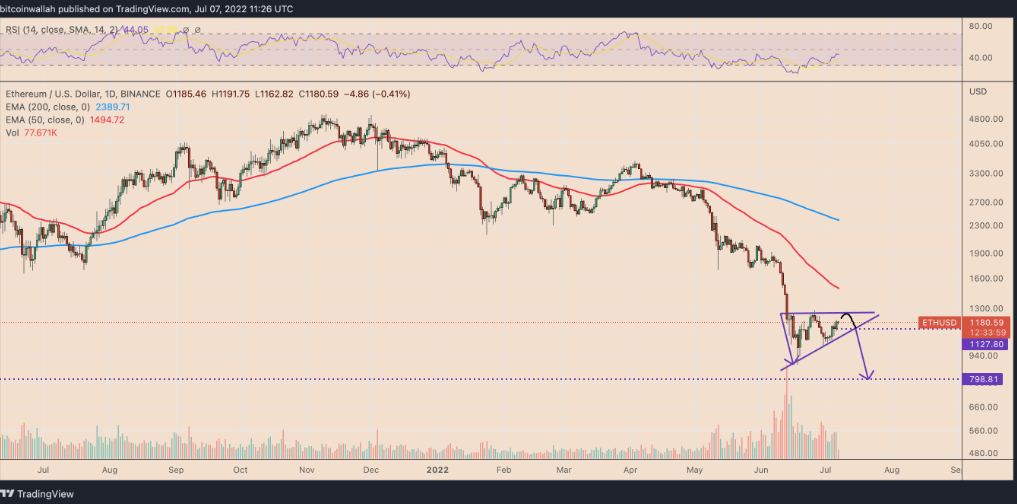
▲ETH/USD daily price chart featuring ascending triangle setup(來源:TradingView)
Conversely, Ethereum's switch to PoS is almost near after a successful trial on July 6, as Cointelegraph covered here. That could have ETH hold above its interim support of around $1,070, as shown in the chart below.
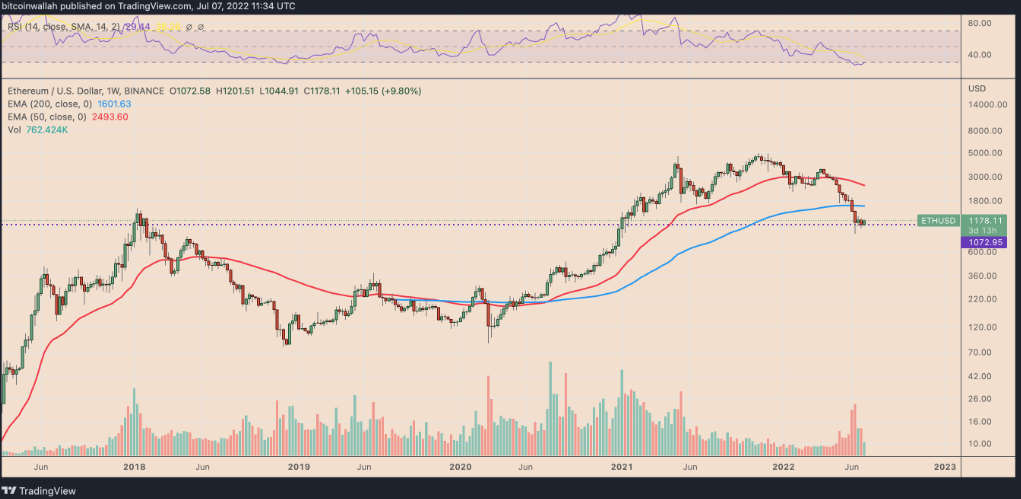
▲ETH/USD weekly price chart(來源:TradingView)
Coupled with an "oversold" relative strength index (RSI) reading (below 30), ETH could rebound toward its 200-week exponential moving average (the blue wave) near $1,600. That would mark a 35%-plus rally from today's price.
A similar setup appears in the ETH/BTC instrument, which tracks Ether's strength against Bitcoin (BTC). Ethereum's successful switch to PoS could have ETH hold above 0.057 BTC, followed by a move upside toward 0.06 BTC, according to Fibonacci retracement graph levels shown below.
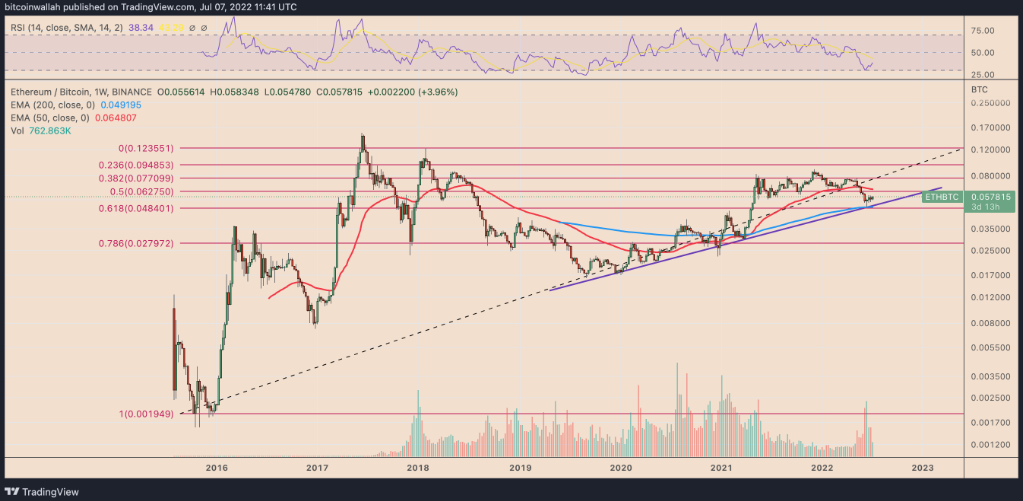
▲ETH/BTC weekly price chart(來源:TradingView)
Meanwhile, macro risks remain the main danger for ETH price, namely the Federal Reserve's potential 75 basis point rate hike in July.
轉貼自: COINTELEGRAPH
若喜歡本文,請關注我們的臉書 Please Like our Facebook Page: Big Data In Finance

留下你的回應
以訪客張貼回應