
摘要: Need to write a README file, but not sure what to say? If this is a frustration that bothers you frequently, you might consider beefing your document up with a diagram. After all, a picture is worth a thousand words, as the cliche goes.

▲Photo by Hanna Morris on Unsplash
This article collects tools that generates graphs for a code repository.
Visualize files by size and type
Let’s start with the most generic tool, repo-visualizer. It plots files as bubbles, indicating their extension names and sizes with colors and sizes, respectively. It's brought to you by GitHub Next, a lab at GitHub the company, and (naturally) it's packaged as a GitHub Action.
Visualize Docker Compose files
The next tool specifically caters to Docker users, but it’s still language-agnostic. To visualize docker-compose.yml, you can use docker-compose-viz:
Here’s how it would look:
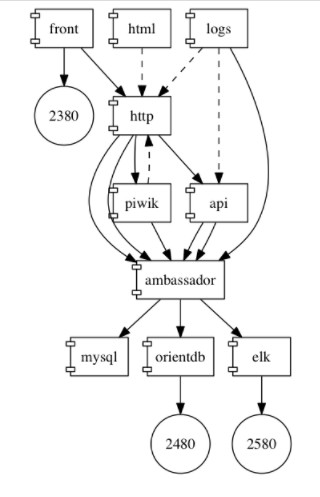
I like how it’s also plotting extra information like open ports and mounted volumes.
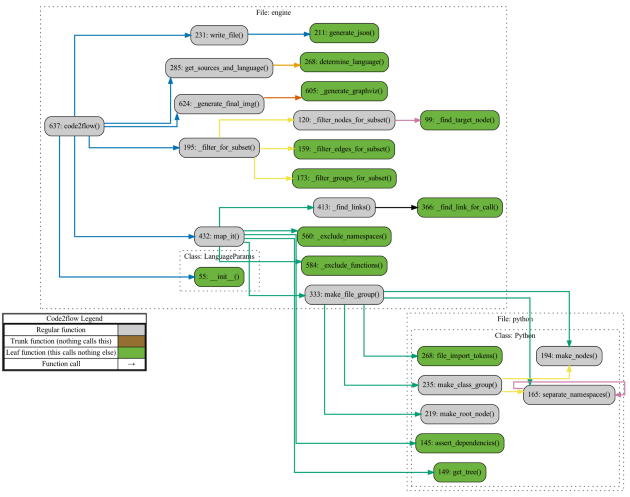
Visualize call graphs
Code2flow supports a couple of dynamic languages, including Python, JavaScript, Ruby, and PHP.
Here’s the example provided in its README:
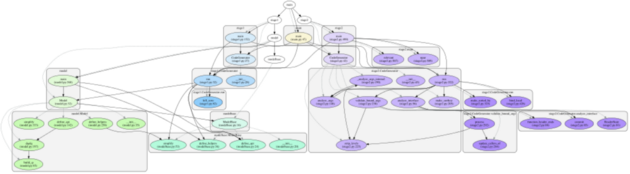
If Python is the only language you care about, you might have heard of pycallgraph , but -- alas, the bane of open source software projects -- the original author had to abandon the project due to personal time constraints. The most sensible alternative I can find is pyan.
Visualize dependencies
A fundamental functionality of build systems and package managers is dependency resolution. As you’d expect, many visualization tools tap into dependency graphs generated by these software to plot diagrams for a repository.
Under the hood, most of these tools use graphviz for the actual plotting work. Therefore, don't be surprised to discover that the diagrams share a similar style.
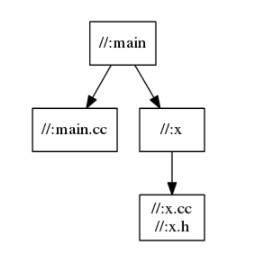
Bazel is a language-agnostic build system. The developers behind Bazel know its users so well that they put up an official guide for visualizing dependencies defined with Bazel:
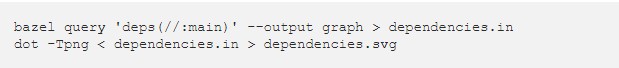
It gives something like this:
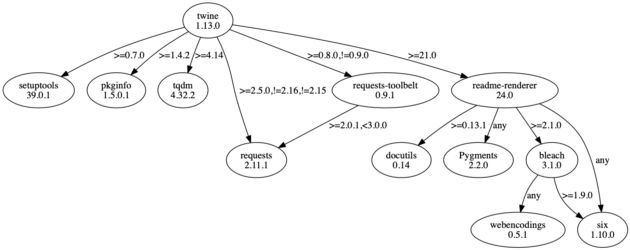
For Python packages in an environment, use pipdeptree:

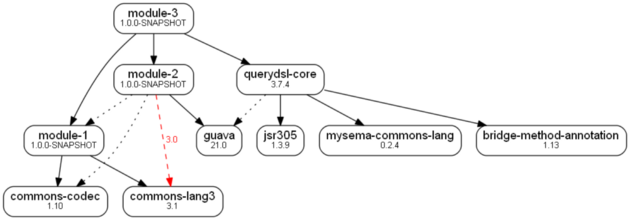
For Java projects built with Maven, depgraph-maven-plugin is the way to go:

/*轉貼來源*/
轉貼自Source: lmy.medium.com
若喜歡本文,請關注我們的臉書 Please Like our Facebook Page: Big Data In Finance

留下你的回應
以訪客張貼回應