
摘要: The idea, in the beginning, was not to solve a regression problem, but a classification one.

▲圖片來源:medium
Hello everyone. Here I will share with you my experience and approach that I used to extract some information from stock prices data.
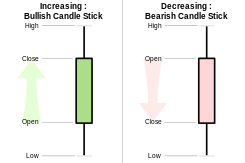
I hope everyone has seen a chart of the stock market. The most popular is a candlestick type that consists of candles. Each holds four values (open, high, low, close). What is a candle and how it is visualized I suggest you read it by yourself. Now let’s start!
Hypothesis
The idea, in the beginning, was not to solve a regression problem, but a classification one.
Having the pattern recognizer model and statistics from the past years the hypothesis was that we will be able to calculate the probability of the next price direction (where the trend will go). For example, if the model recognizes a pattern after which 8 times of 10 we have a bullish trend then we should open a long position. With this hypothesis, let’s move to stock prices data.
Stock prices data is a multivariate time series (4-dimensional time series). Taking the rolling mean and applying, for example, the ARIMA model wasn’t considered a good solution, because it will be highly biased.
On the other hand, in the beginning, I didn’t want to use rolling mean because I thought we’d lose a lot of data. For example, after averaging the values of these two different candles, the output will be the same. Also, we were trying to apply SOM (Self-Organizing Map) ANN for unsupervised clusterization, it didn’t turn out well. The output was complete chaos.
Additionally, I want to mention that LSTM (Long Short Term Memory) fits pretty well for predicting stock prices, but we didn’t use it, because we were trying to solve the classification problem.
I started looking for already existing technology that can find similar patterns within a certain window. And found one.

This library was STUMPY. The idea behind it is very simple for one-dimensional time series and a little bit more complicated for multivariate.
You can read about STUMPY here: https://stumpy.readthedocs.io/en/latest/Tutorial_STUMPY_Basics.html#
Why did I find stumpy useful?
First of all, It searches for motifs. And how stumpy defines “Time series motifs are approximately repeated subsequences found within a longer time series”. And at this point, I decided to come back to the idea of using rolling mean to simplify the problem.
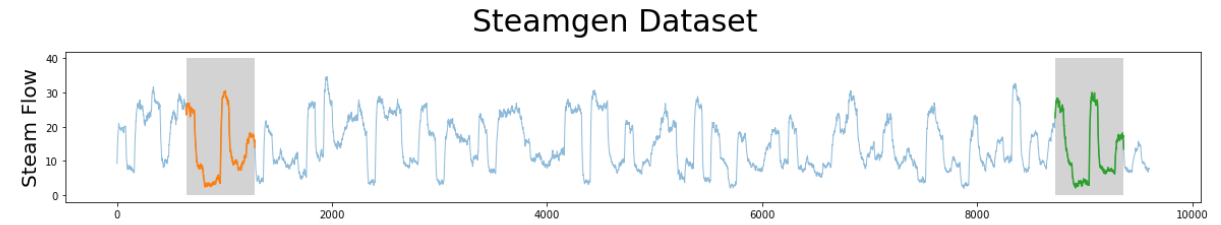
▲an example is taken from STUMPY docs(來源:medium)
Problems with finding patterns in the multi-dimensional time series
It requires a lot of computational power because it is most likely that one of the dimensions will be just a random walk. And we have to identify it somehow. Also, we have to choose the minimum amount of dimensions that we can use to identify motif.
Finding the general patterns within a certain window
Stumpy finds pairs of patterns and therefore there will be a lot of them. But I wanted to get general representation. So, I wrote the script that was merging them by correlation coefficient. But before that, I had to remove trend from taken sequences, to avoid common time series mistakes (https://www.svds.com/avoiding-common-mistakes-with-time-series/). I did it by applying differencing.
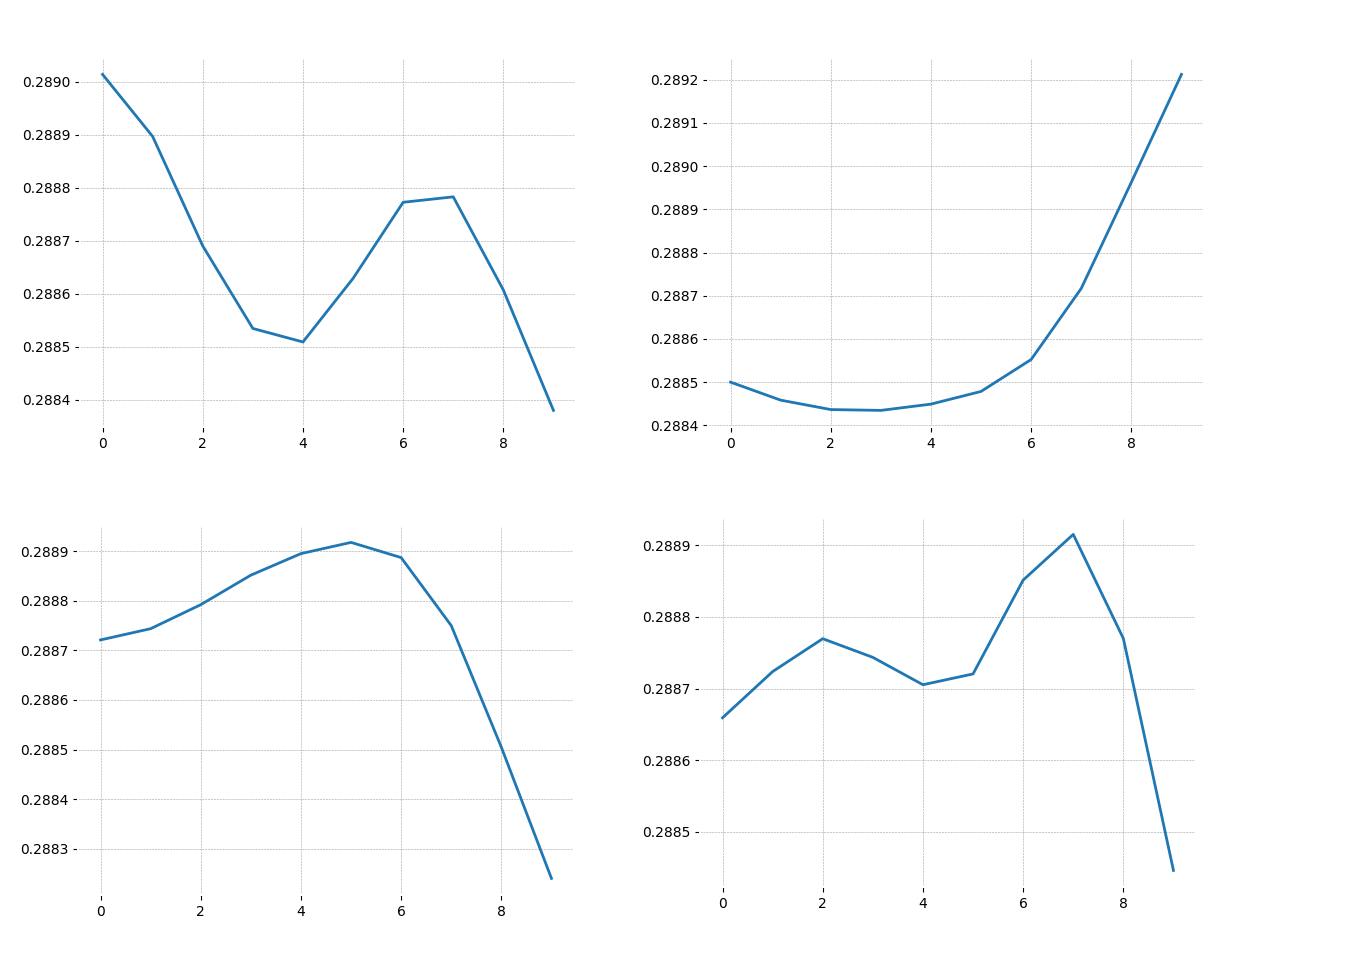
▲results(來源:medium)
Building classifier
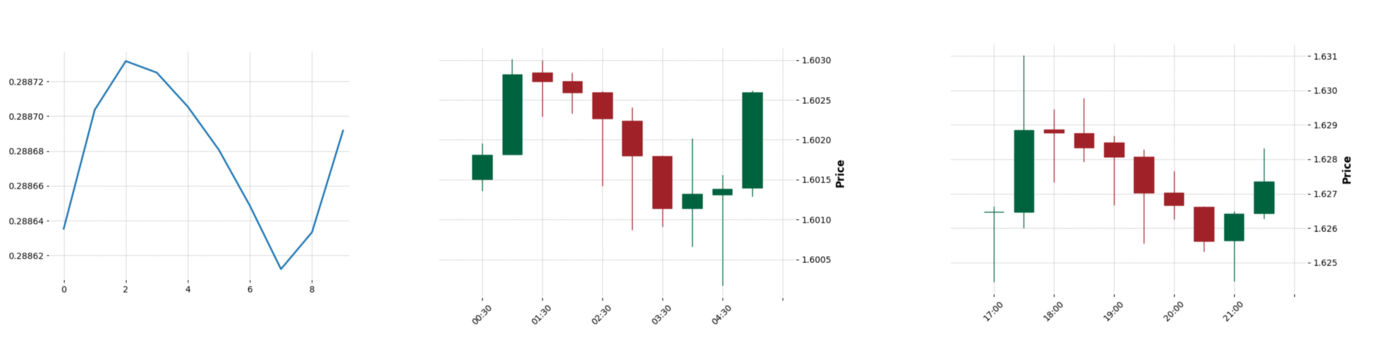
Each chart above represents a separate class. The classifier takes a rolling mean of sequences and assigns the class with the highest correlation.
Additionally, I added the condition that the sequence has to match a border of its nearest class. What do I mean by ”border”? A candle can be bullish or bearish. So, if we take 2–3 records from each side of the sequence and identify their types, it will be our border. For me, it was important that the classified pattern has to start and end the same way and can vary in its body.
The result that I got (visualizations are generated with mplfinance):
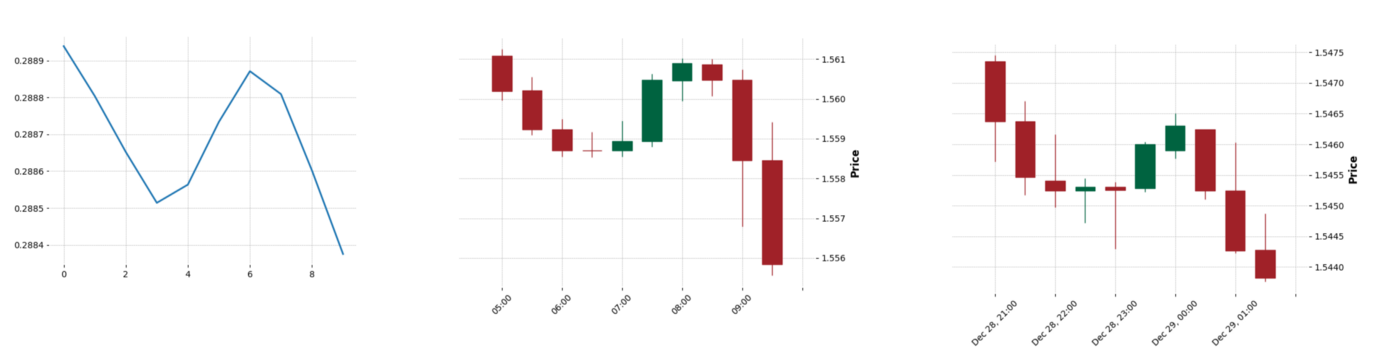
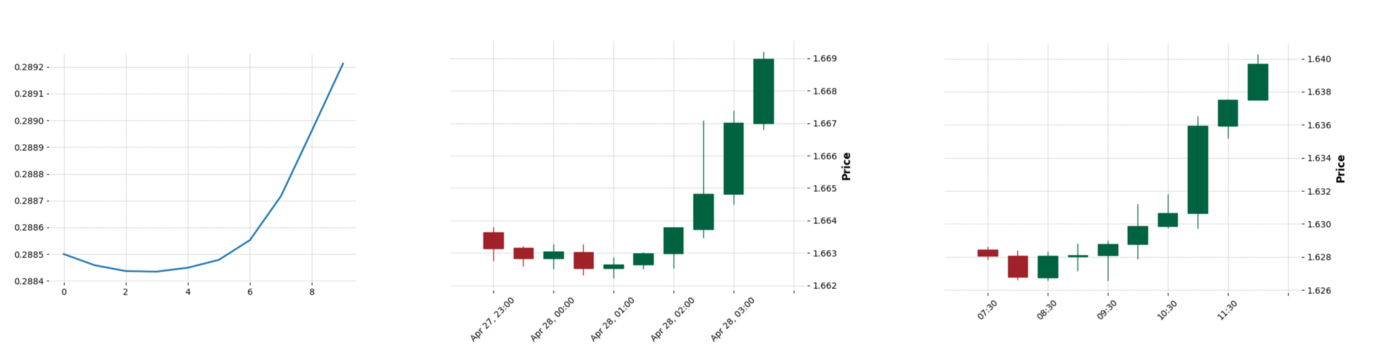
轉貼自Source: medium.com
若喜歡本文,請關注我們的臉書 Please Like our Facebook Page: Big Data In Finance

留下你的回應
以訪客張貼回應