摘要: Fundamentally, trading is about analyzing the supply and demand of a security (asset which can be traded), such as stocks, commodities, or Forex pairs. A trader then makes decisions to purchase or sell these securities, ideally for a profit. When entering a trade, there are numerous factors to take into consideration, such key price levels, liquidity, and momentum.

Fundamentally, trading is about analyzing the supply and demand of a security (asset which can be traded), such as stocks, commodities, or Forex pairs. A trader then makes decisions to purchase or sell these securities, ideally for a profit. When entering a trade, there are numerous factors to take into consideration, such key price levels, liquidity, and momentum.
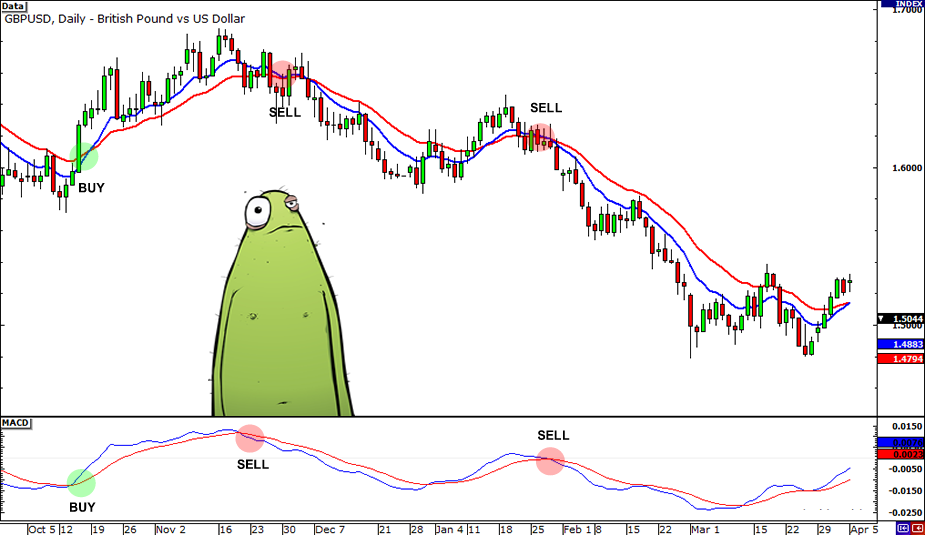
Momentum is the speed of movement for a security’s price. With respect to supply and demand, a security with strong momentum is experiencing an imbalance of demand over supply when price is rising, or supply over demand when price is falling. To the extent momentum is directly and fundamentally related to supply and demand, it is very important for traders to have a means to measure and analyze a security’s momentum.
Instead of basing the rate of change on percentages, expressing momentum in ‘multiples of volatility’ (MoV) is another alternative. The calculation for a volatility based momentum (VBM) indicator is very similar to ROC, but divides by the security’s historical volatility instead. The average true range indicator (ATR) is used to compute historical volatility.
VBM(n,v) = (Close — Close n periods ago) / ATR(v periods)
......


留下你的回應
以訪客張貼回應